
Measuring social media ROI isn’t just about likes and shares – they’re vanity metrics that don’t show real business impact. To prove the value of your social media efforts, focus on metrics tied to business goals, like leads, sales, customer acquisition costs (CAC), and customer lifetime value (CLV). Here’s a quick summary of what matters:
- Track Conversions: Use tools like Google Analytics to monitor signups, purchases, and other actions.
- Measure Financial Impact: Calculate CAC, CLV, and ROI to link campaigns to revenue.
- Analyze Website Traffic: Check metrics like time on site, bounce rate, and conversions from social visitors.
- Monitor Brand Perception: Use sentiment analysis and share of voice to understand public opinion.
Key Metrics That Show Real Results
Tracking Leads and Sales
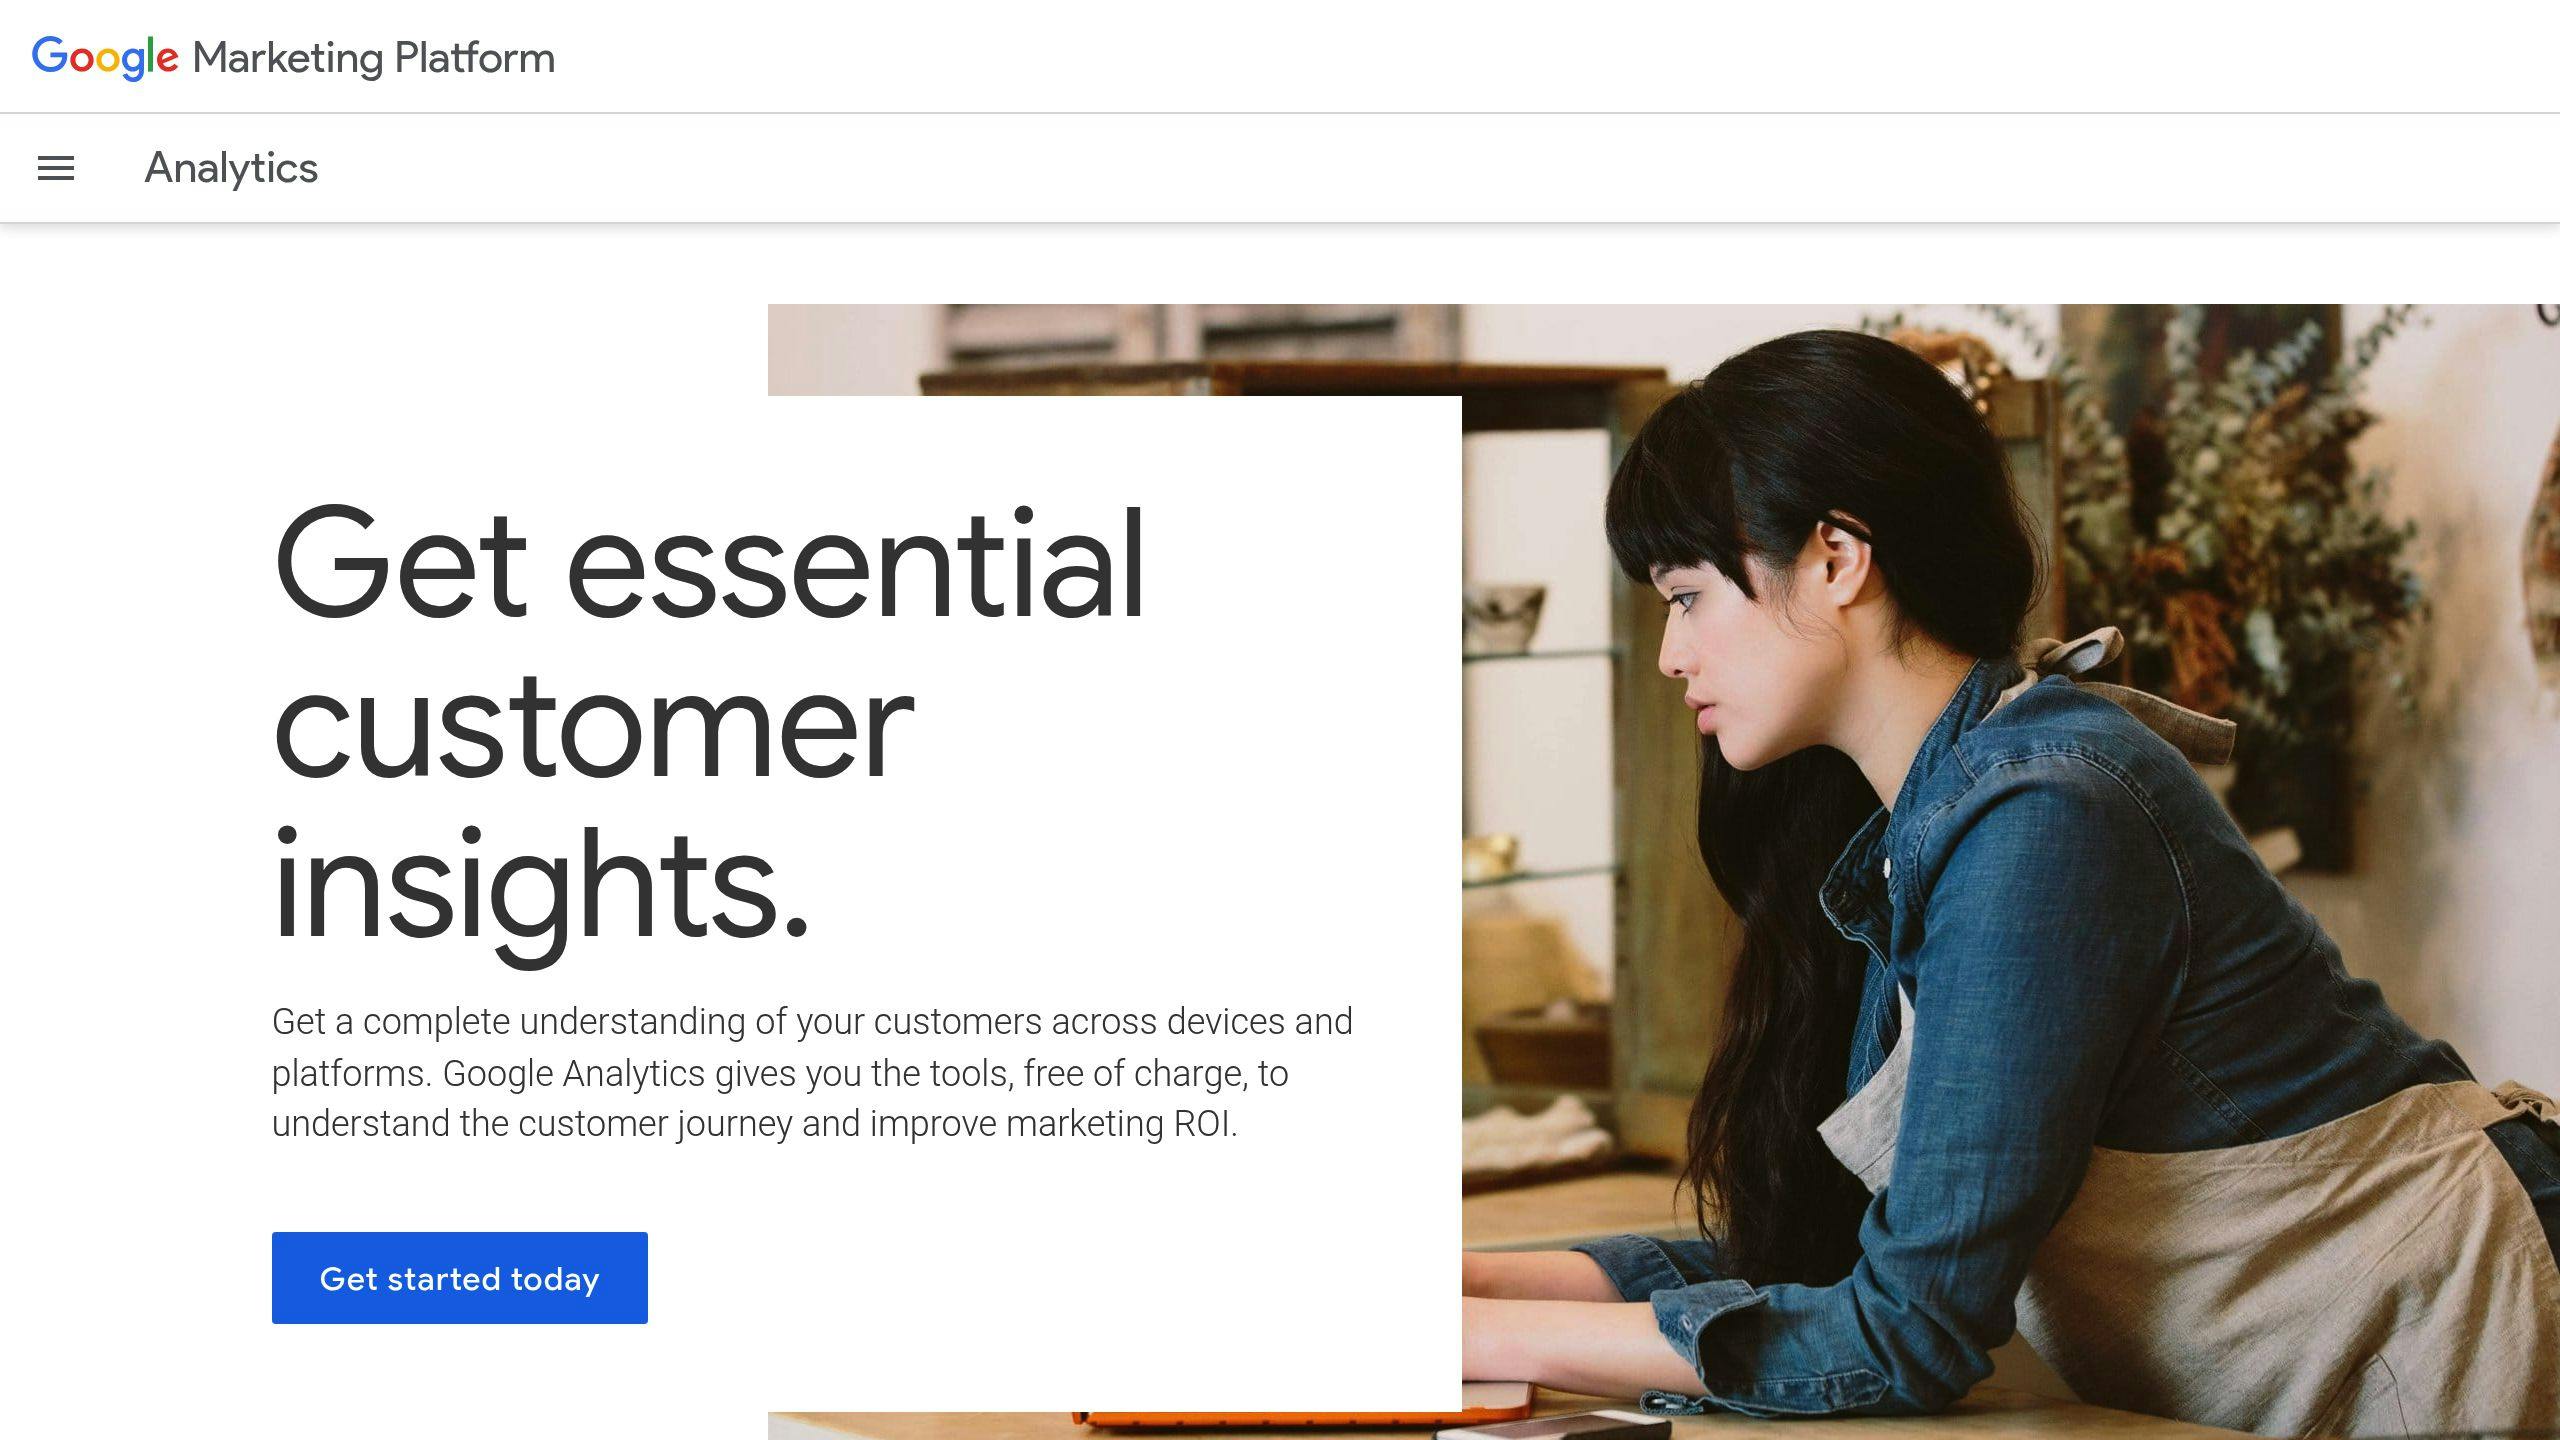
To gauge the true impact of social media, businesses must track how it contributes to generating leads and driving sales. Tools like Google Analytics can help set up conversion goals to monitor actions that start on social platforms. These actions might include newsletter signups, demo requests, purchases, or content downloads.
The key is proper attribution tracking. By implementing conversion tracking across your platforms, you can pinpoint which channels and types of content lead to the most valuable customer actions.
Cost Per Customer and Revenue Impact
To understand the financial effects of social media, focus on two essential metrics: Customer Acquisition Cost (CAC) and Customer Lifetime Value (CLV).
| Metric | How to Calculate | Why It Matters |
|---|---|---|
| CAC | Total Campaign Spend ÷ New Customers | Tracks how efficiently you’re acquiring customers |
| CLV | Average Purchase Value × Purchase Frequency × Customer Lifespan | Highlights the long-term value of a customer |
| ROI | (Revenue – Cost) ÷ Cost × 100 | Measures the overall financial return |
Tracking both paid and organic efforts separately ensures you can identify which strategies offer the best returns. These financial metrics tie your social media efforts directly to business outcomes, making them indispensable.
Website Performance from Social Traffic
Website analytics offer a window into how social media visitors behave once they land on your site. Key indicators to monitor include:
- Time on Site: Longer visits often mean higher engagement.
- Pages per Session: A higher count suggests users are exploring more content.
- Bounce Rate: A lower rate signals that your content is resonating.
- Conversion Rate: Tracks the percentage of social visitors completing goals like purchases or signups.
Using UTM parameters in your social media links ensures accurate tracking and helps identify which platforms and campaigns drive the most valuable traffic.
These metrics don’t just show where you stand – they also guide you on how to refine and improve your strategies.
Related video from YouTube
Tools to Track Social Media Results
These tools help businesses measure key metrics like conversions, customer acquisition costs, and lifetime value with accuracy.
Setting Up Google Analytics
Google Analytics is a powerful tool for tracking social media performance. To get started:
- Set up conversion goals and event tracking to monitor actions such as signups, purchases, video plays, or button clicks.
- Adjust channel settings to ensure traffic from social platforms is attributed correctly.
Using UTM Links for Campaign Tracking
UTM parameters are crucial for identifying which social media efforts bring in the most valuable traffic and conversions.
| UTM Parameter | Purpose | Example |
|---|---|---|
| Source | Tracks the platform | utm_source=instagram |
| Medium | Specifies the content type | utm_medium=social |
| Campaign | Labels the campaign | utm_campaign=spring_sale_2025 |
By assigning unique UTM codes to each campaign, you can determine which posts or ads deliver the best ROI.
Social Media Analytics Platforms
Dedicated analytics platforms go beyond basic engagement metrics. Tools like Sprout Social, HubSpot, and Hootsuite provide advanced tracking for ROI, audience behavior, and detailed reporting. These insights help link social media efforts to broader business objectives.
Equipped with these tools, businesses can measure both financial and non-financial outcomes, offering a complete view of their social media performance.
sbb-itb-edfb666
Measuring Money and Non-Money Results
Tracking both financial and non-financial outcomes helps businesses understand how social media supports their goals.
Long-term Customer Value
Customer Lifetime Value (CLV) sheds light on the financial benefits of social media over time. Engagement levels directly influence CLV and retention rates:
| Engagement Level | Average CLV Impact | Retention Rate |
|---|---|---|
| High (weekly interaction) | 45% higher CLV | 78% retention |
| Medium (monthly interaction) | 28% higher CLV | 62% retention |
| Low (quarterly or less) | Baseline CLV | 41% retention |
HubSpot analytics connects social media interactions with purchases and retention, helping businesses identify which types of content and strategies yield the most valuable customers.
While CLV captures financial gains, social media also shapes how the public views a brand and its reputation.
Brand Impact and Public Opinion
Social media’s influence on public perception combines numbers and insights. Tools like Brandwatch measure:
- Sentiment ratio: The balance of positive vs. negative mentions.
- Share of voice: How often your brand is mentioned compared to competitors.
- Response rate: How quickly customer inquiries are addressed.
These metrics help businesses refine their strategies to strengthen brand reputation. Beyond perception, social media also delivers practical benefits like cost savings.
Cost Reduction Benefits
Social media can cut costs in several areas. For instance, chatbots on social platforms lower customer service expenses by 20%, speed up response times by 35%, and increase customer satisfaction by 15%.
User-Generated Content (UGC) is another cost-effective tool. It reduces the need for branded content, drives engagement, and resonates more with audiences. Monitoring the balance between UGC and branded content ensures you’re maximizing its benefits.
Setting Up Long-term Measurement
Tracking social media performance over time helps identify areas for improvement and align efforts with business goals. Here’s how to set up a framework for ongoing measurement:
Regular Performance Reports
Establish a consistent schedule for performance reports to connect key metrics with business outcomes. Here’s a breakdown:
| Report Component | Metrics to Track | Review Frequency |
|---|---|---|
| Revenue Impact | Conversion rates, Sales from social | Monthly |
| Cost Efficiency | Cost per acquisition, Ad spend ROI | Bi-weekly |
| Engagement Health | Sentiment ratio, Response times | Weekly |
| Traffic Quality | Time on site, Pages per visit | Monthly |
Automating these reports can save time and ensure you’re consistently monitoring progress.
Testing What Works
With reporting in place, testing allows you to refine strategies and boost results. Focus on areas like:
- Ad creative and content formats
- Posting schedules and frequency
- Call-to-action language
- Audience targeting settings
Use a dashboard to track the outcomes of these tests. Allow each test to run for at least two weeks to collect enough data for reliable conclusions. Then, apply what you learn to improve performance across all platforms.
Aligning Metrics with Business Goals
To make your long-term measurement system actionable, tie social metrics directly to your business objectives. Here’s how:
- Revenue Growth: Measure customer lifetime value from social media-driven customers.
- Brand Awareness: Track share of voice and sentiment trends.
- Customer Service: Monitor response times and resolution rates.
- Lead Generation: Calculate cost per qualified lead by channel.
Tools like Sprout Social or Hootsuite can help automate tracking for these metrics. Revisit and update your framework every quarter to keep it aligned with shifting business priorities.
Conclusion: Showing Results to Leadership
Once you’ve set up a solid measurement framework, the next step is making sure leadership understands the results.
Key Areas to Highlight
When presenting ROI to leadership, focus on metrics that tie directly to business goals. Balance financial outcomes with broader strategic insights by emphasizing these areas:
| Focus Area | What to Measure | Why It Matters |
|---|---|---|
| Revenue Impact | Conversion rates, Sales attribution | Shows direct financial contributions |
| Cost Efficiency | Customer acquisition costs, Ad ROI | Highlights smarter use of resources |
| Customer Value | Lifetime value, Retention rates | Reflects long-term customer impact |
| Brand Impact | Sentiment analysis, Share of voice | Demonstrates market positioning |
Steps to Take
Turn your social media data into insights leadership can act on with these steps:
- Set up dashboards: Track key metrics like conversions, customer acquisition costs (CAC), and customer lifetime value (CLV) in real time.
- Hold quarterly reviews: Use these sessions to adjust strategies and ensure alignment with business priorities.
When it’s time to present:
- Stick to the most relevant data – don’t overwhelm with too much detail.
- Explain complex metrics in simple, clear terms.
- Link every result back to the organization’s goals.
- Use benchmarks and historical data to provide context.
The goal is to show both the financial and strategic impact of social media efforts, giving leadership a full picture of how these initiatives drive business success.
FAQs
These FAQs address common questions about tracking and analyzing social media ROI, providing practical tips and tools.
How can you track social media conversions?
Use Google Analytics to monitor conversions. Navigate to Acquisition -> Social -> Conversions to see two key insights:
- Assisted Social Conversions: Shows how social media supports the conversion process.
- Last-Click Social Conversions: Highlights when social media is the final step before a conversion.
To go further, combine Google Analytics with tools tailored to specific platforms:
| Platform | Key Tracking Features | Best For |
|---|---|---|
| Meta Pixel | Tracks purchases, custom events | E-commerce |
| HubSpot | Offers lead scoring, attribution data | B2B lead generation |
| Sprout Social | Provides cross-channel analytics | Multi-platform ROI |
What are the 4 metrics to analyze social media performance?
Focus on these four metrics to connect social media efforts with business goals:
- Awareness Metrics: Gauge visibility with data like impressions, reach, and brand mentions.
- Engagement Metrics: Measure audience interactions, including click-through rates (CTR) and referral traffic.
- Lead Generation Metrics: Track actions like sign-ups and content downloads.
- Revenue Metrics: Assess financial results, such as sales and return on ad spend (ROAS).
To measure these effectively, use UTM parameters and set up goal tracking in Google Analytics.